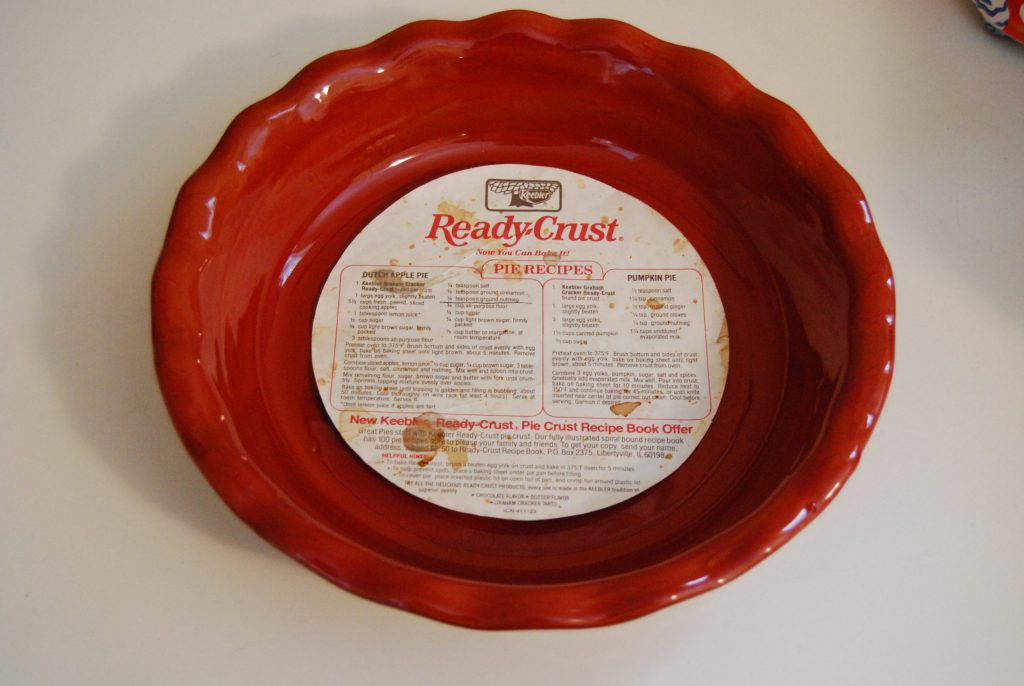
I love to bake. I love to bake pies. My husband’s favorite pie is Dutch apple crumb pie. I’ve been using the same recipe I found on the back of a Ready Crust® pie crust label. That was 30 years ago when we first got married! My younger daughter’s favorite is pumpkin pie. The kind that uses One Pie® pumpkin and molasses.
Lately, I’ve found that I am making a lot of pies, but not for dessert. Rather, I’m using PowerPoint and Excel to show various retirement savings and income concepts to clients and associates. They are one of my “recipes for retirement.” Tried and true approaches that will help you get to retirement
PowerPoint Pie Charts Lead to Recipes for Retirement
Late one night, I was working on a presentation that needed a pie chart. I wondered how the pie was transformed from a delectable, delicious dessert to the symbol of portfolio allocation. How did we ever decide to divide a simple circle into sections? Sure, it’s a basic geometry task to show different sizes of sectors. But pies should be a slice of dessert with whipped cream on top. I must have been hungry at the time.
So, I did a little research to find out how we ended up using a circle with lines as a retirement readiness tool. Interestingly, a Scottish engineer is credited with the first use of the “pie chart.” He’s the founder of statistical graphics, William Playfair. That was back in 1801. He was trying to communicate numerical data in a more visual format. Especially he needed to show a relationship between parts that made up a whole. (You can Google Mr. Playfair for some interesting history.) Historians believe that the first graphical representation in a pie chart is of the Turkish Empire. It shows the split between Europe, Asia and Africa before 1789. From Playfair’s book, Statistical Breviary, published in 1801.
Even Social Security Uses Pie Charts
Ever since then, analysts, mathematicians, economists, and investment managers have been using pie. Just a circle with lines radiating from a center point can depict various relationships between numbers. An excellent retirement income pie chart is from Social Security. It shows where retirees get their income once they retire. The percent between Social Security, pensions, earnings and assets. (Income of the Aged Chartbook, 2010, published 2012. See page 17.)
This pie chart says that if you are in the top income group (making over $58,000), you can only count on Social Security for about 17.3% of your income. Are you surprised by how small this slice of your income pie might be?
The chart also shows how traditional defined benefit pensions might cover about another 19% of your income pie. Earnings (as in money from working) and your assets from retirement plans provide the other 60% or more of retirement income.
That is a lot of heavy lifting needed from your retirement portfolio! You’ll have to create your own recipes for retirement income. Millions of leading-edge Boomers have already figured out that it can be done.
Set Up Your Own Recipe for Retirement with Portfolio Pies
It’s important to make your retirement savings work harder. One tip: set up your portfolio properly for your current risk tolerance and time horizon. Advisors and investment managers show your retirement savings as slices of pie. Each wedge of the pie shows the value of your different investments This way, you can see your actual allocation and compare it to a target allocation. (Meaning, how large each slice of the pie should be). Sometimes the two are pretty far off. For example, if your target is a balanced pie, you would typically have about 50% in stocks, 40% in bonds and 10% cash. In reality, your pie might have 75% in stocks, 20% in bonds and 5% in cash.
Comparing your real investment pie to your target pie can help you see where your retirement investments really are. You can then decide if you were baking the wrong pie (target allocation is off the mark). Or slicing some of the pieces too large or too small (investment adjustments needed). There are lots of resources about setting up the best investment allocation for your retirement savings. Just google “investment allocation” or “diversified portfolio” to get started.
It’s one thing to bake from a recipe, but completely different to create your own recipe. I suggest you bake your favorite pie. Cut a big piece. Top it with whipped cream and eat it while looking at your retirement statements and investments. Things always go better with pie!
Recipes for Retirement – dessert and retirement planning:
Apple: https://www.keebler.com/en/yummy-recipes/pie-crust/baked-dutch-apple-pie-recipe/
Pumpkin: https://newenglandrecipes.com/new-england-pumpkin-pie/
Retirement Income: Income of the Aged Chartbook, 2010, published 2012. See page 17.